GIS_portfolio
One page bid to design a map for website
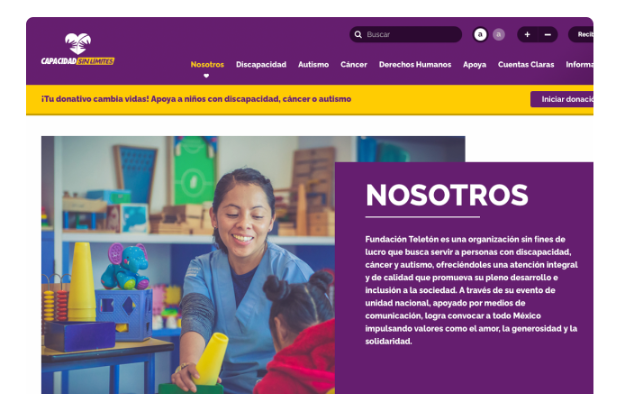
This is their website current style,
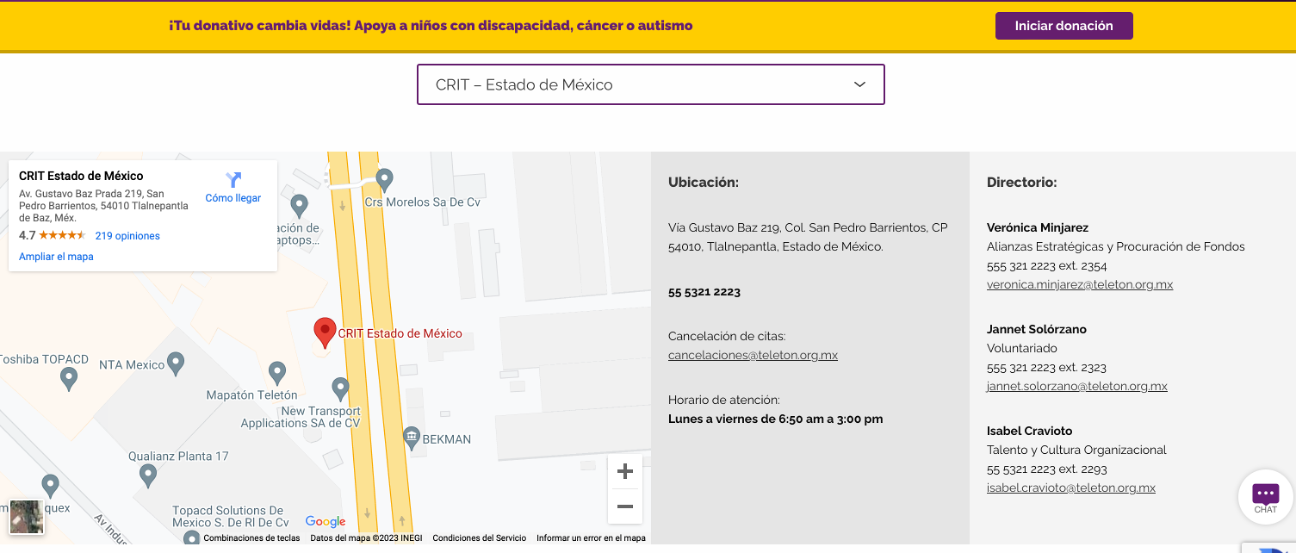
This is the map they currently use to show the users where their rehablitation centers are:
The project includes the following activities and deliverables. The table also includes time and cost estimates:
| Date (day) | Task - description | Hours/cost estimate | Hours/cost actual |
|---|---|---|---|
| Phase 1 | |||
| Day 1 | Develop a map that matches the overall look and feel of the organization site. | 2 | 1.4 |
| Day 1 | Create an accessible web page that includes screenshots at three distinct zoom levels using the redesigned base map | 2 | 1.2 |
| Day 1 | Provide a link on the web page to a downloadable JSON file. | 0.5 | 0.8 |
| Day 1 | Create simple instructions documenting the provided materials and how to effectively use them. | 2 | 0.5* |
| Phase 2 | |||
| Day 1 | Develop an interactive map utilizing the Google API. The map shall be embedded on a demonstration HTML page that the client can access. | 2 | 0.8* |
| Day 1 | Create and deploy a KML file that shows point locations for client sites (these can be real or hypothetical). | 2 | 0.6* |
| Day 1 | Ensuring the API and credentials are correctly utilized and secured. | 2 | 0.7* |
| Total | 9.5 ($950) | 6.0 ($600) | |
Some comments and thoughts about going from the estimates to the actual time of execution: In all cases I overestimated the time it would take me to complete each of the tasks; however, I do think that the level of depth that I went into each of them may not be the ideal if I were to actually deliver this to an organization. For example, the activities whose actual time have an asteriscs are those that I think I could have spent more time exploring the tools, creating something more tailored to the client, and making sure that eveything is set up to work properly (for example, about the API credentials, I am not 100% sure they are properly setup even though I did secure them, but I would feel more comfortable having spent more time in understanding how they work).
Additionally, I was surprised by the relatively low estimate that I ended up with ($950), but again, I do think that it has to do with how much in depth I can go with each of these activities.
I also had some troubles with the exported layer as a kml, as I was not able to keep my customized icons. If I were to include time for debugging these kind of errors, then the actual time would definetely go up.
Work developed
Color palette
Based on the organization image and style, I selected the following color palette to customize their basemap: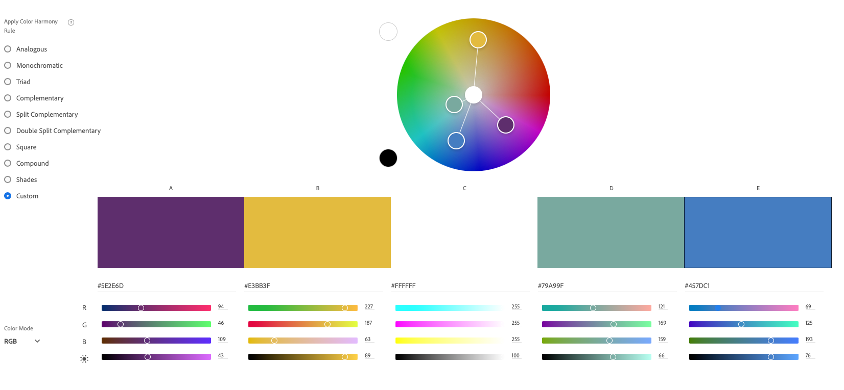
Finished Map
The following maps shows the 22 centers located all across Mexico
(Note: I could not make the customized icon work when exporting the kml :(, it kept defaulting to the white drop)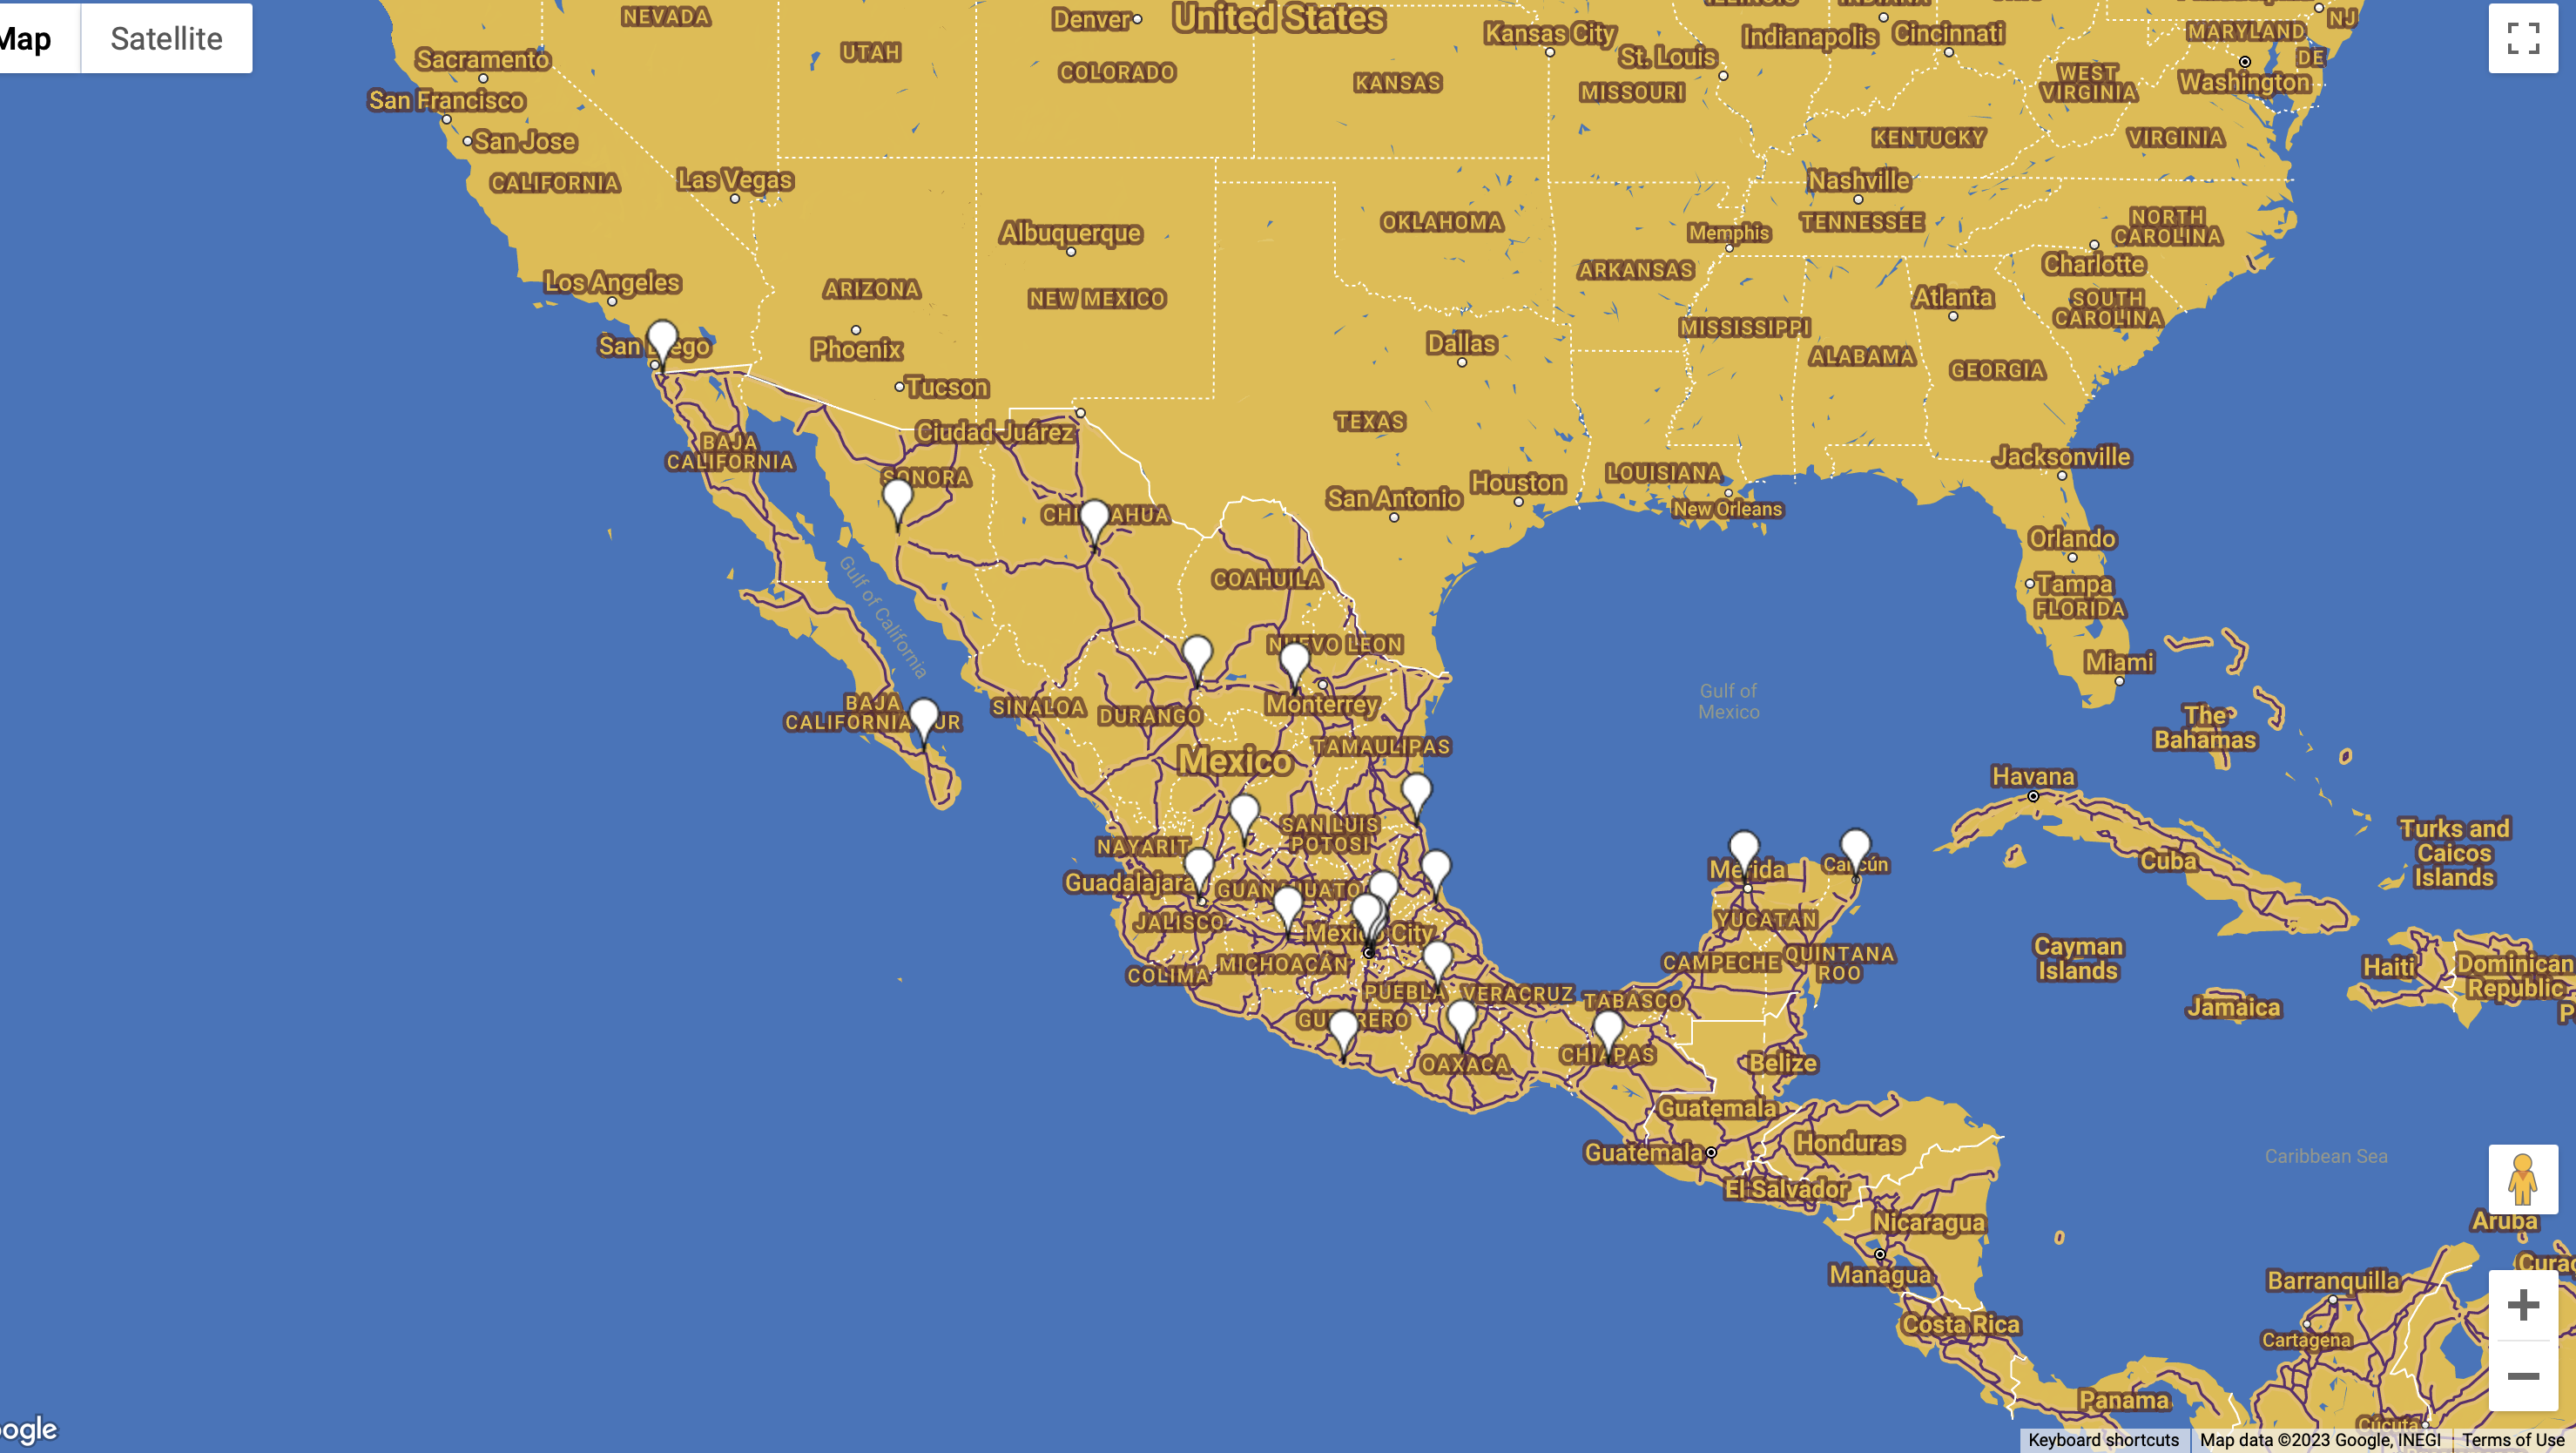
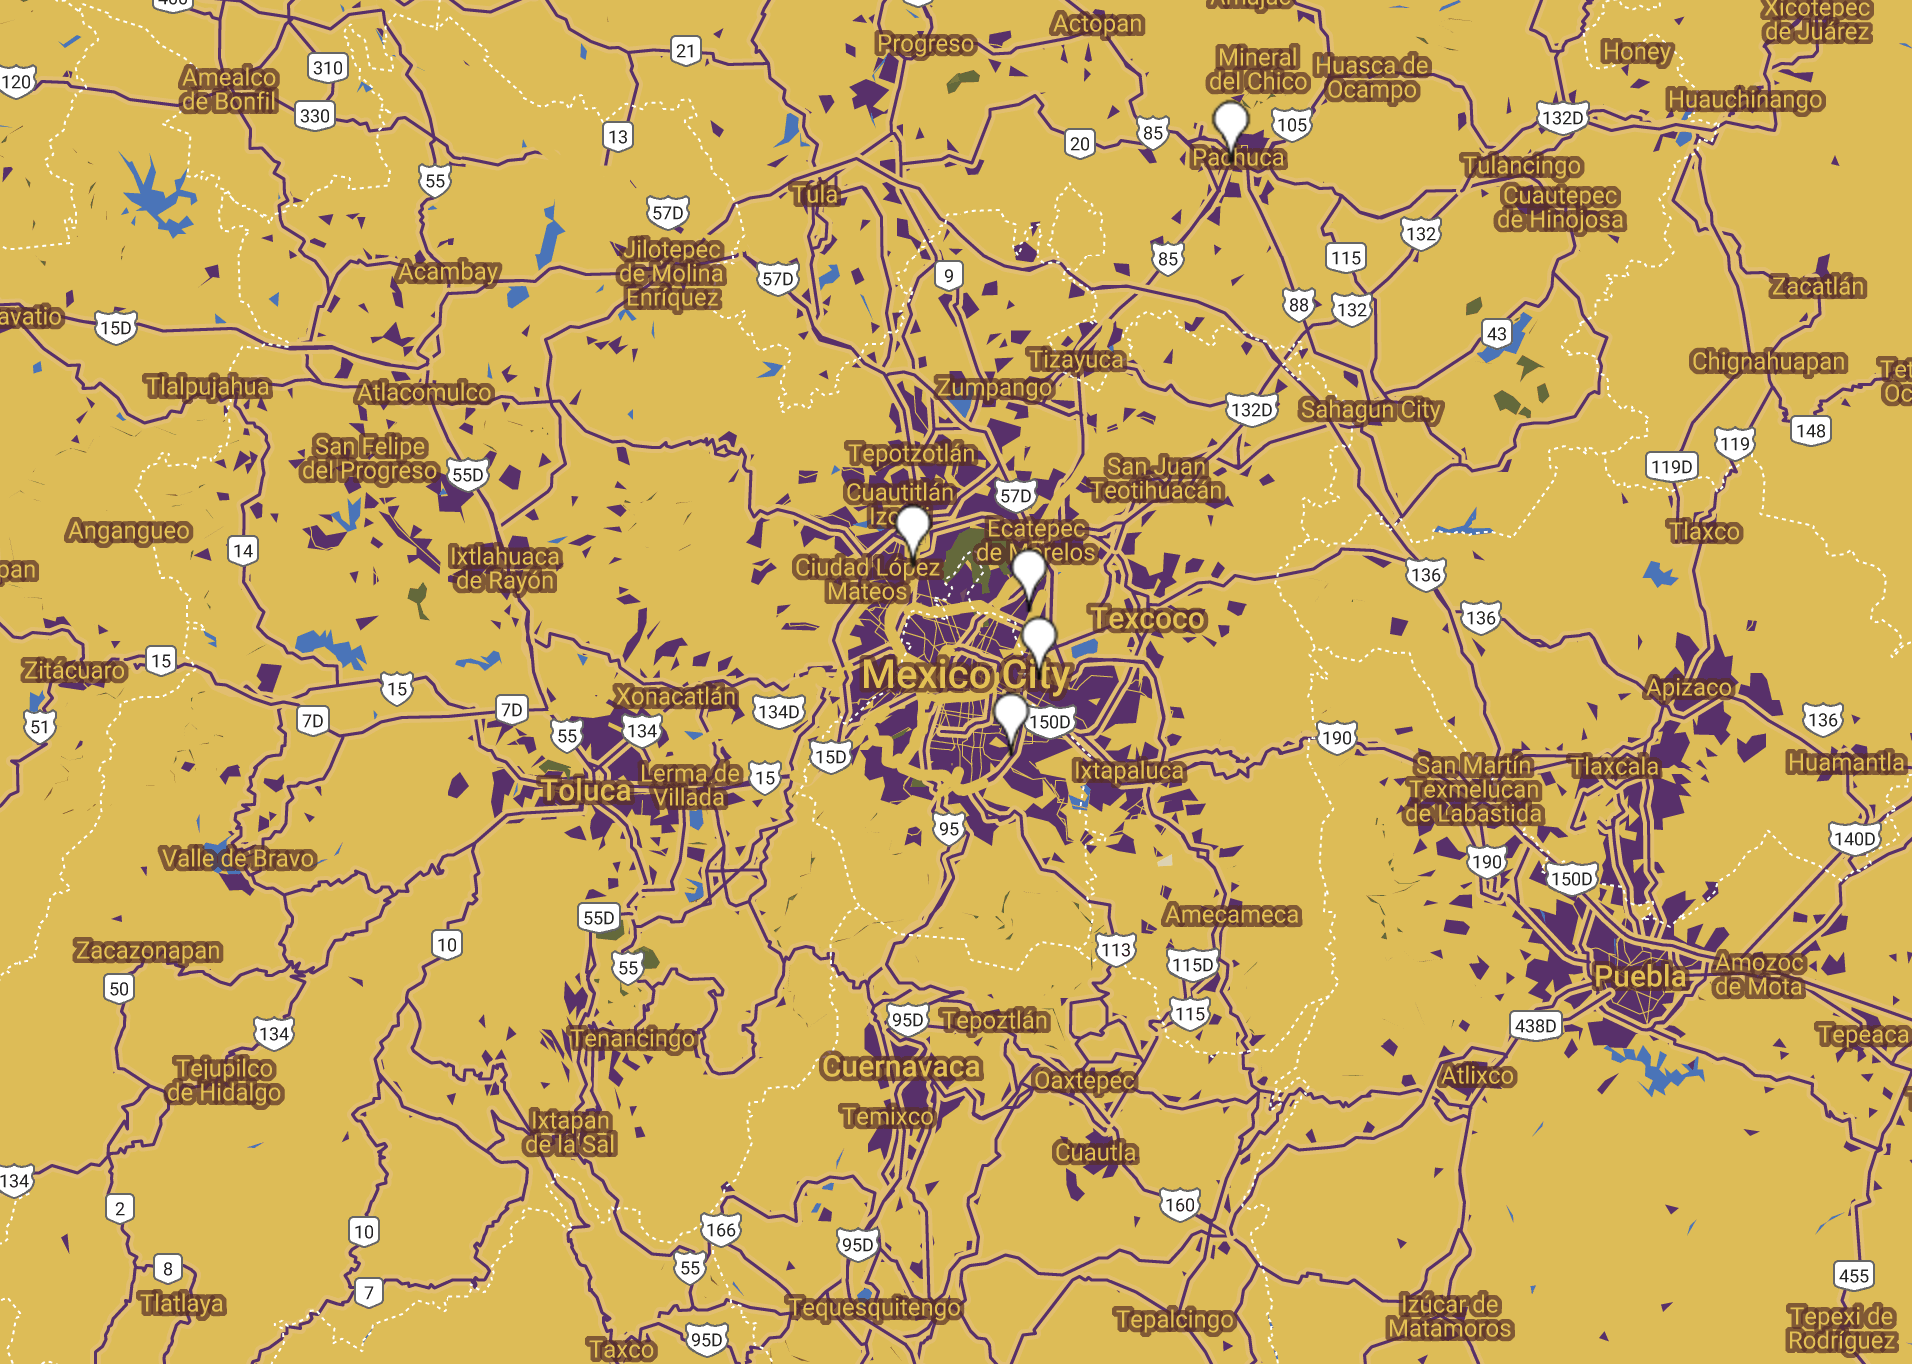
This is a zoom to the central part of the coutry, where Teleton has four rehabilitation centers
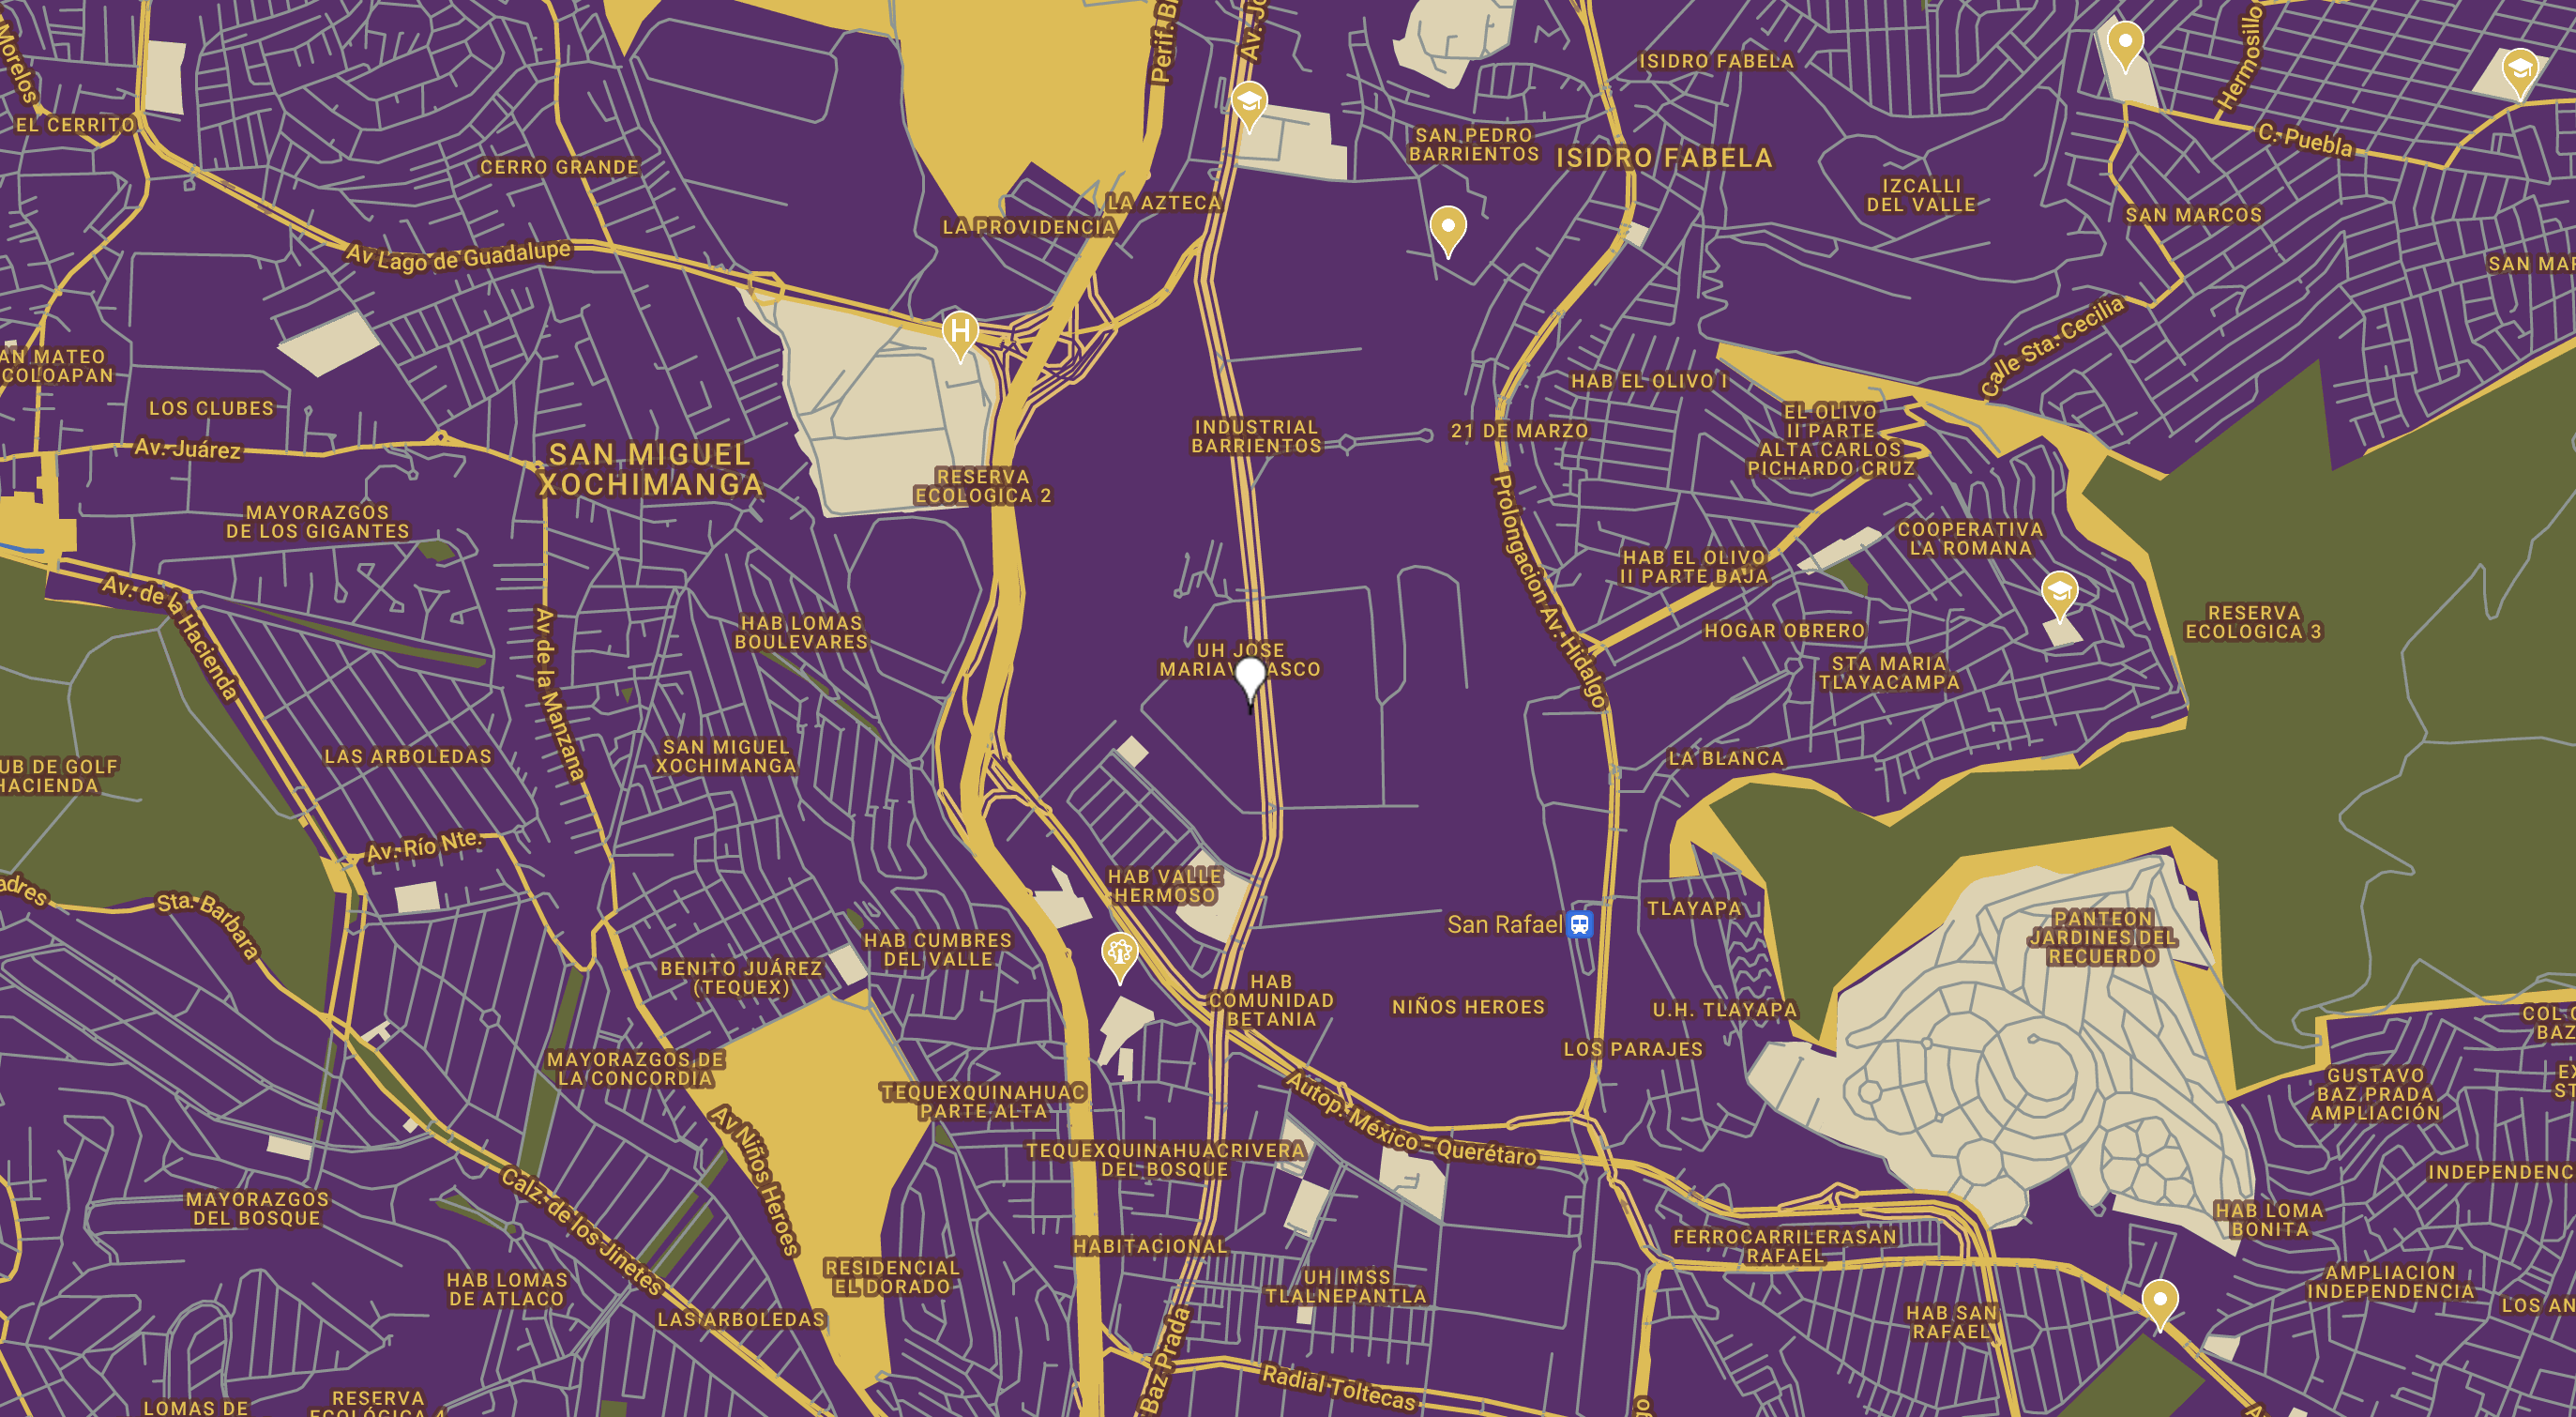
This is a zoom to Mexico City, specifically to Teleton central office and largest rehabilitation center
Link to the map
The map can be accessed and interacted with in the following link --> MAPLookup table
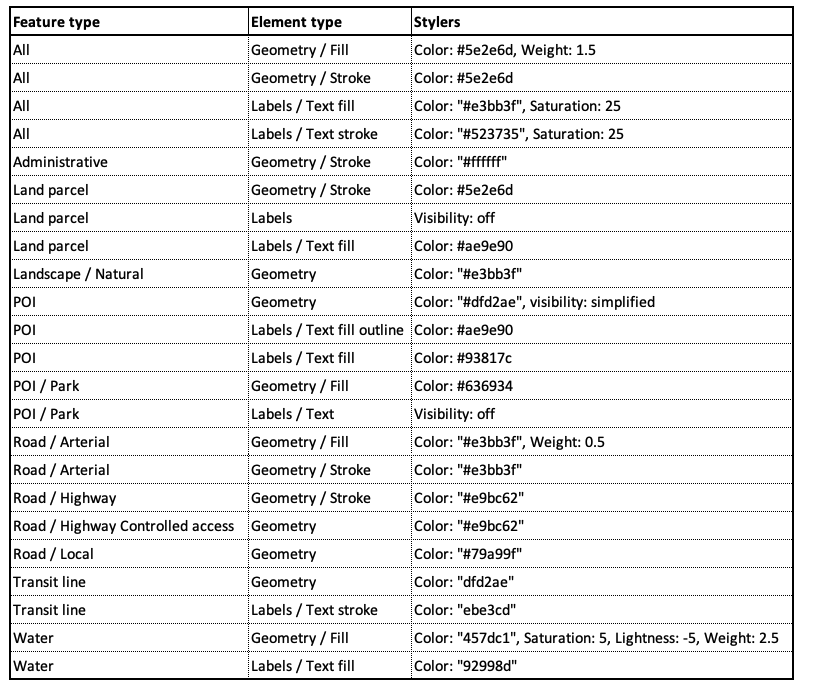
The following lookup table summarizes the styles used for the basemap: